Product Tour

Equity Insider walkthrough

Equity Insider helps investors turn unstructured company information into structured, decision-ready signals. It aggregates 13F filings, expert network transcripts, CEO commentary, management letters, brokerage notes, Substack posts, and US political disclosures into a single intelligence layer to identify hidden positioning, story changes, and early inflections.

The walkthrough below follows the investor workflow from document ingestion to company screening, with each screen framed by what it enables in practice for research, monitoring, and idea generation.

Latest Documents

The document workflow starts from a feed of the latest uploaded research. Users can scan by source type, relevance, sector, covered companies, and report date before opening a structured document view.

Documents
Latest uploaded reports screen

Landing: ingest any research format

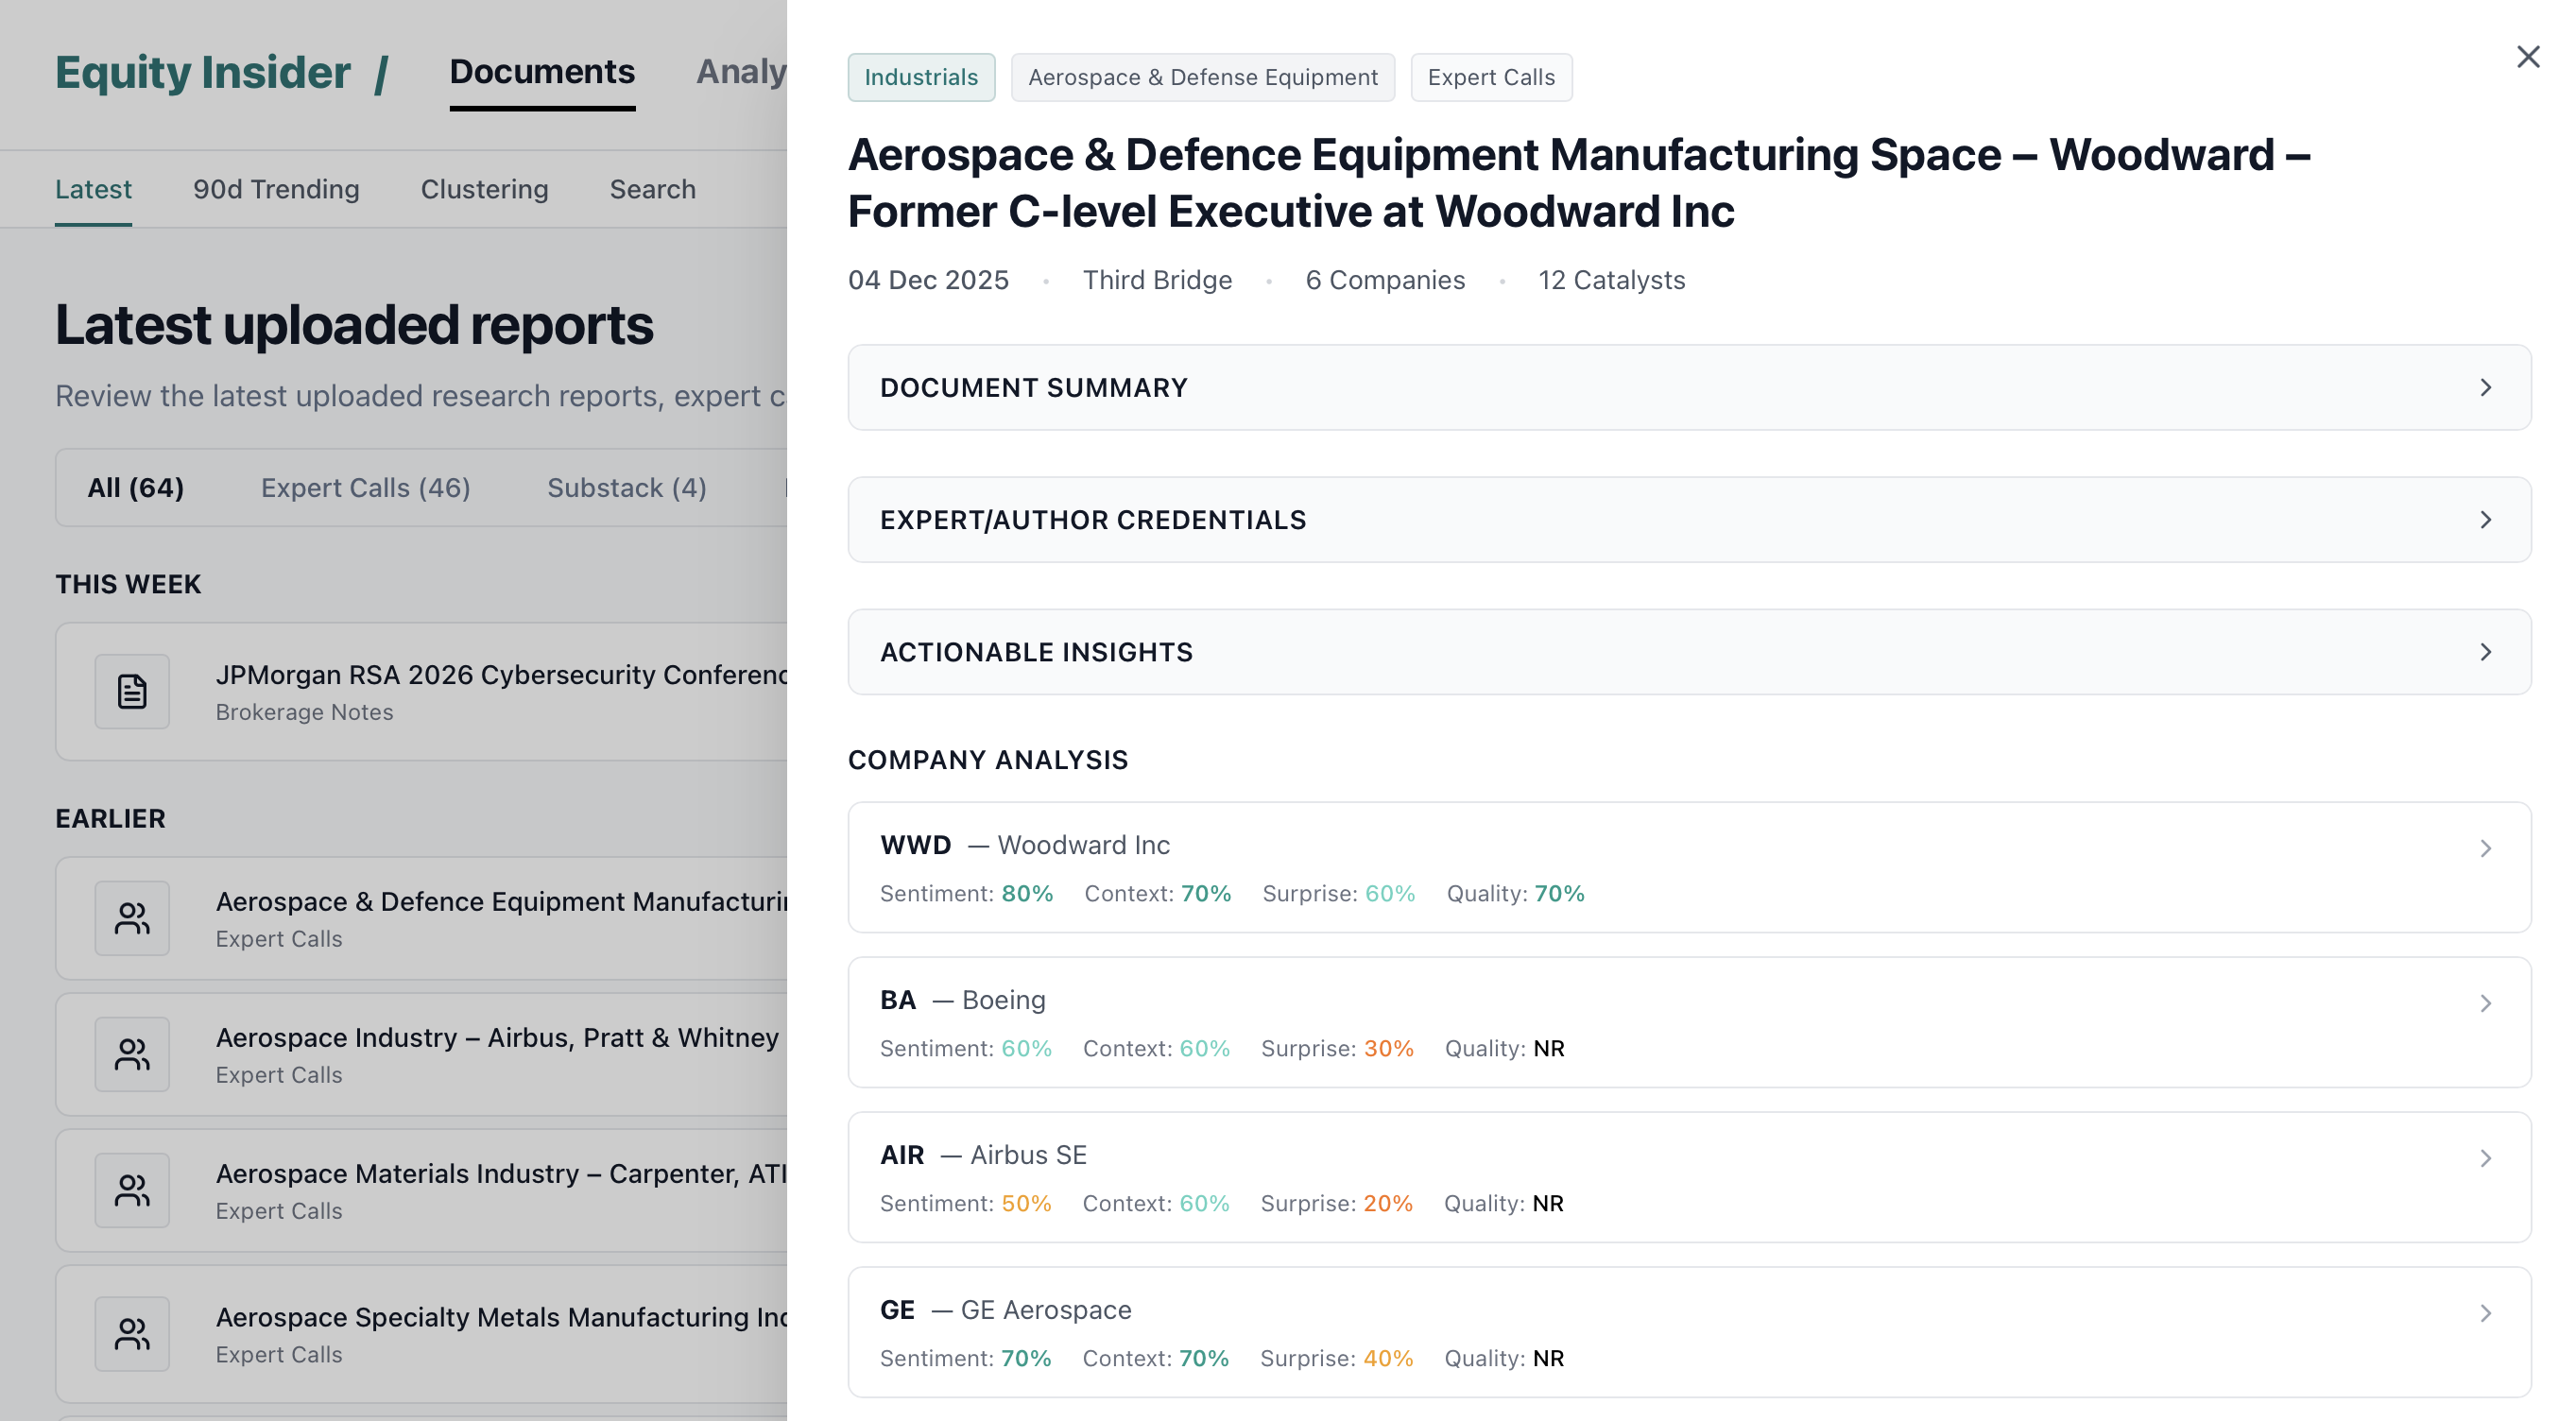
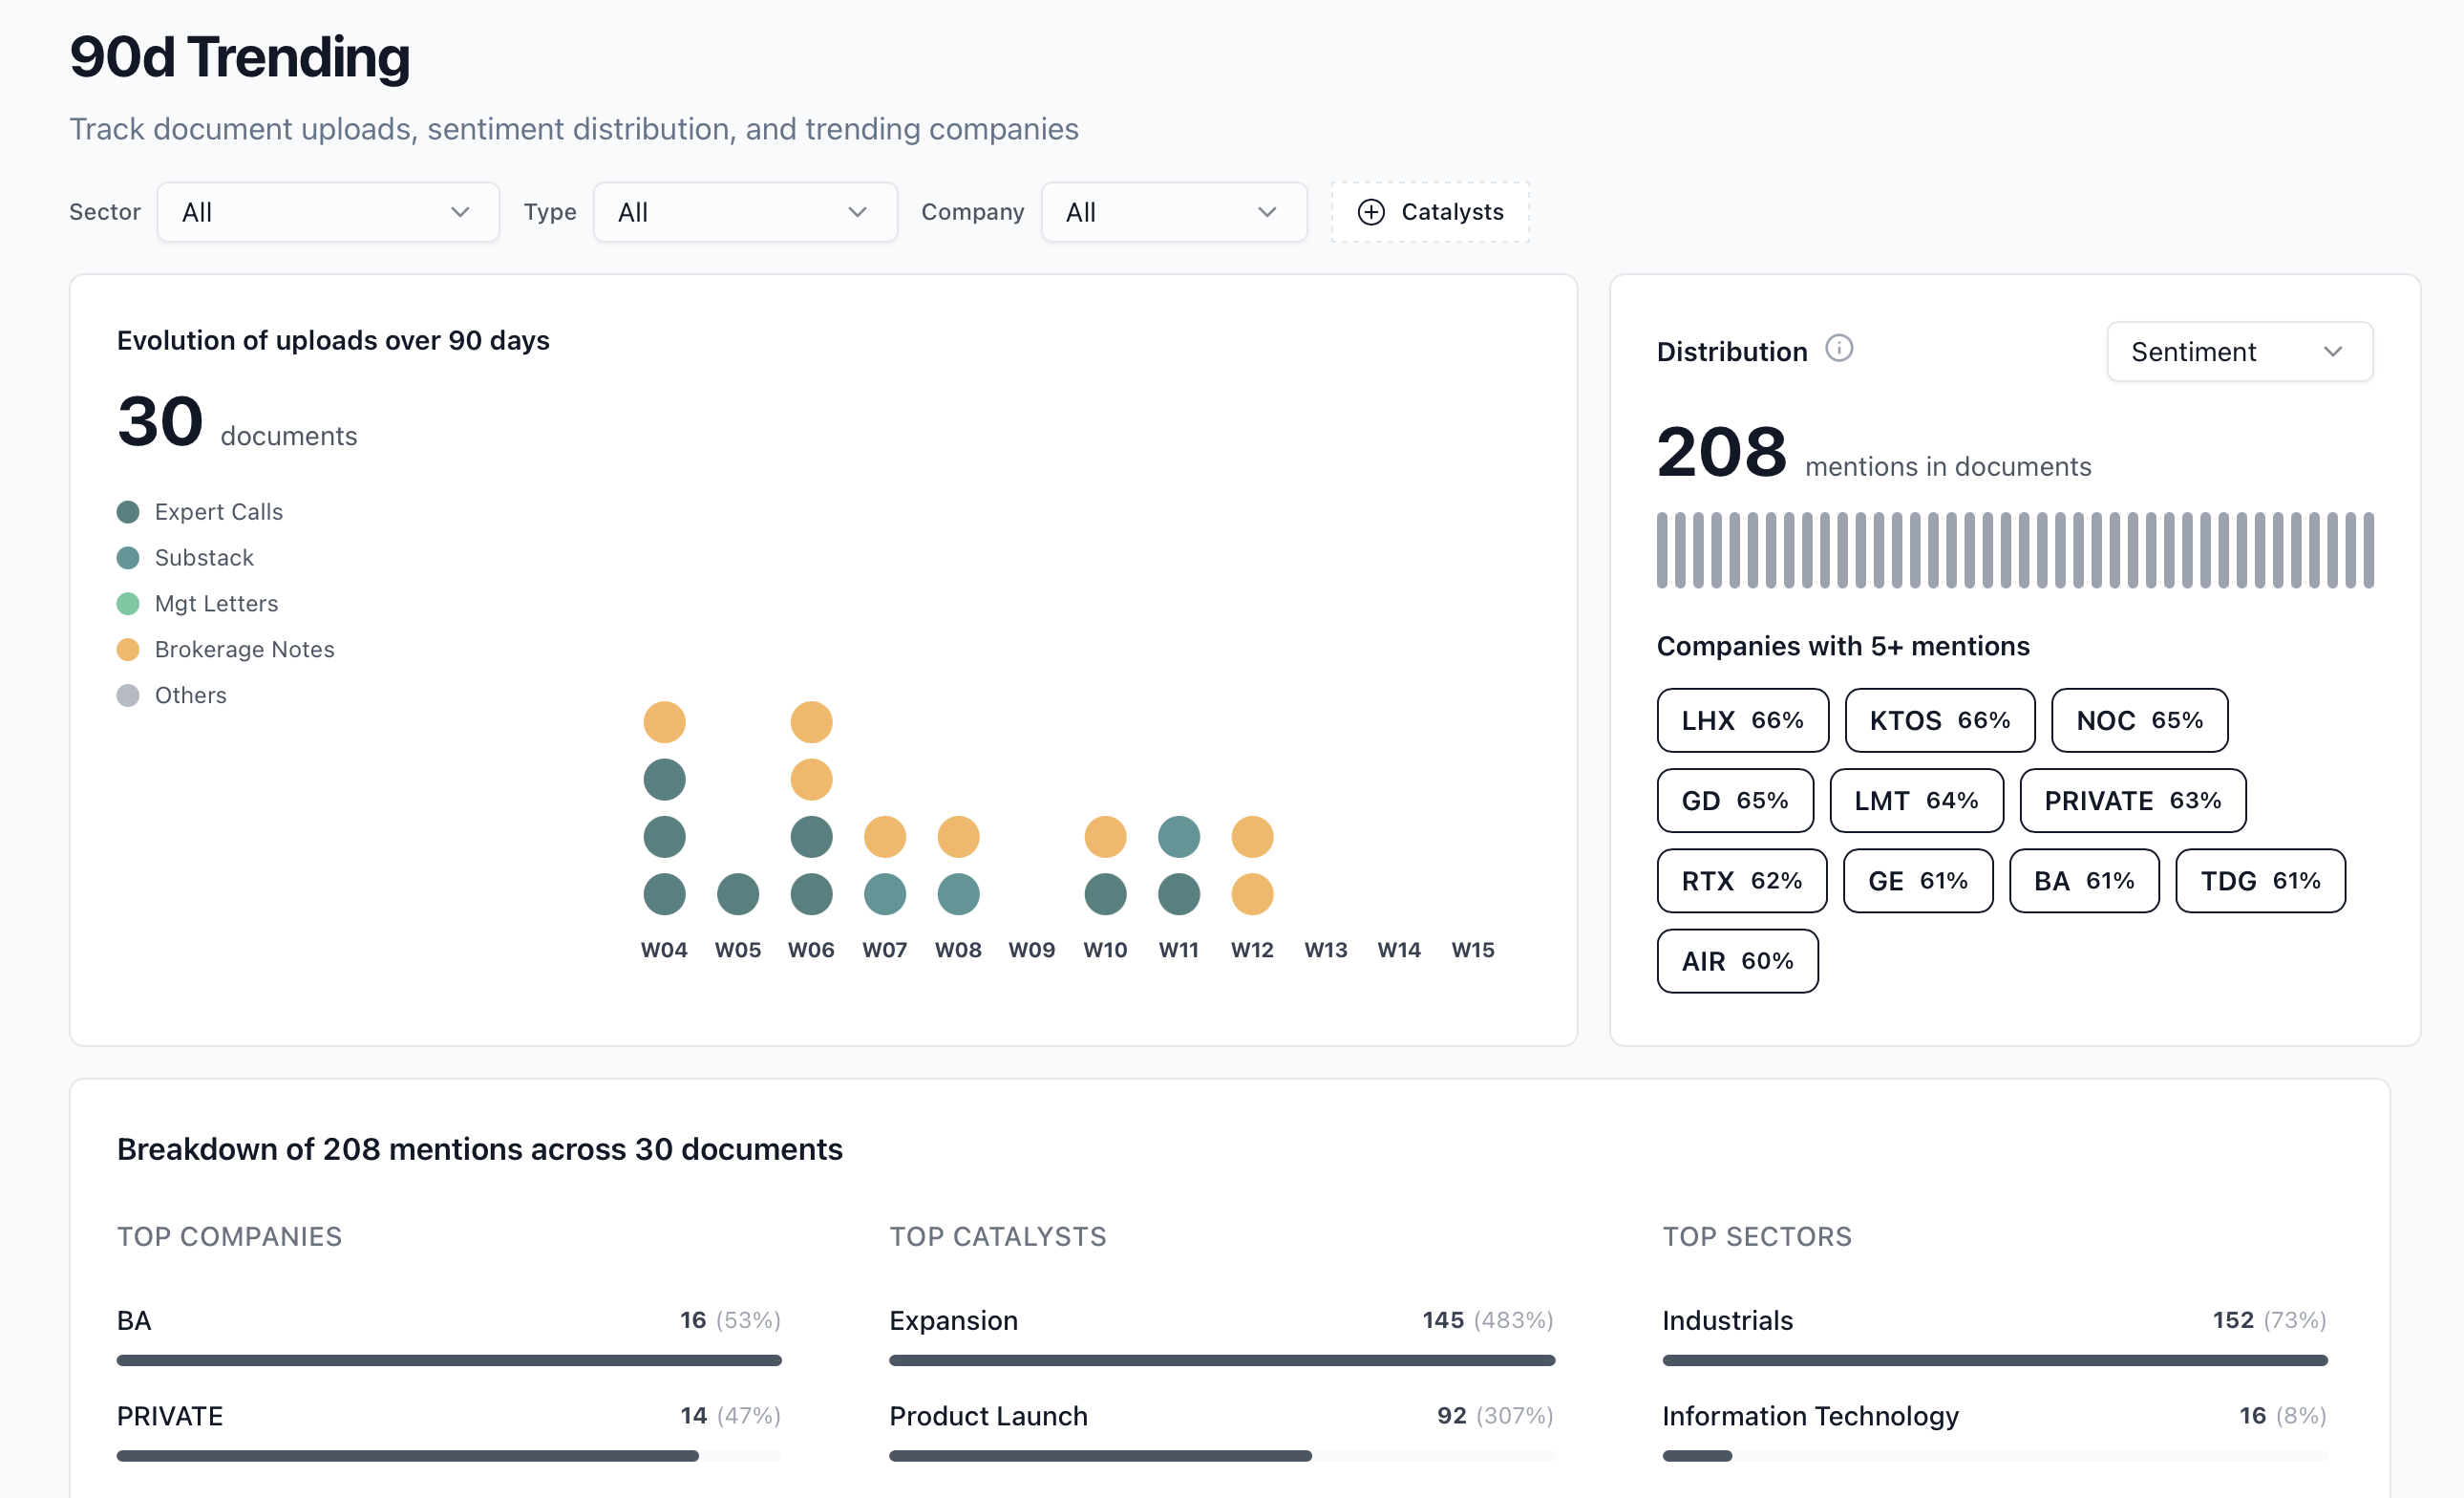
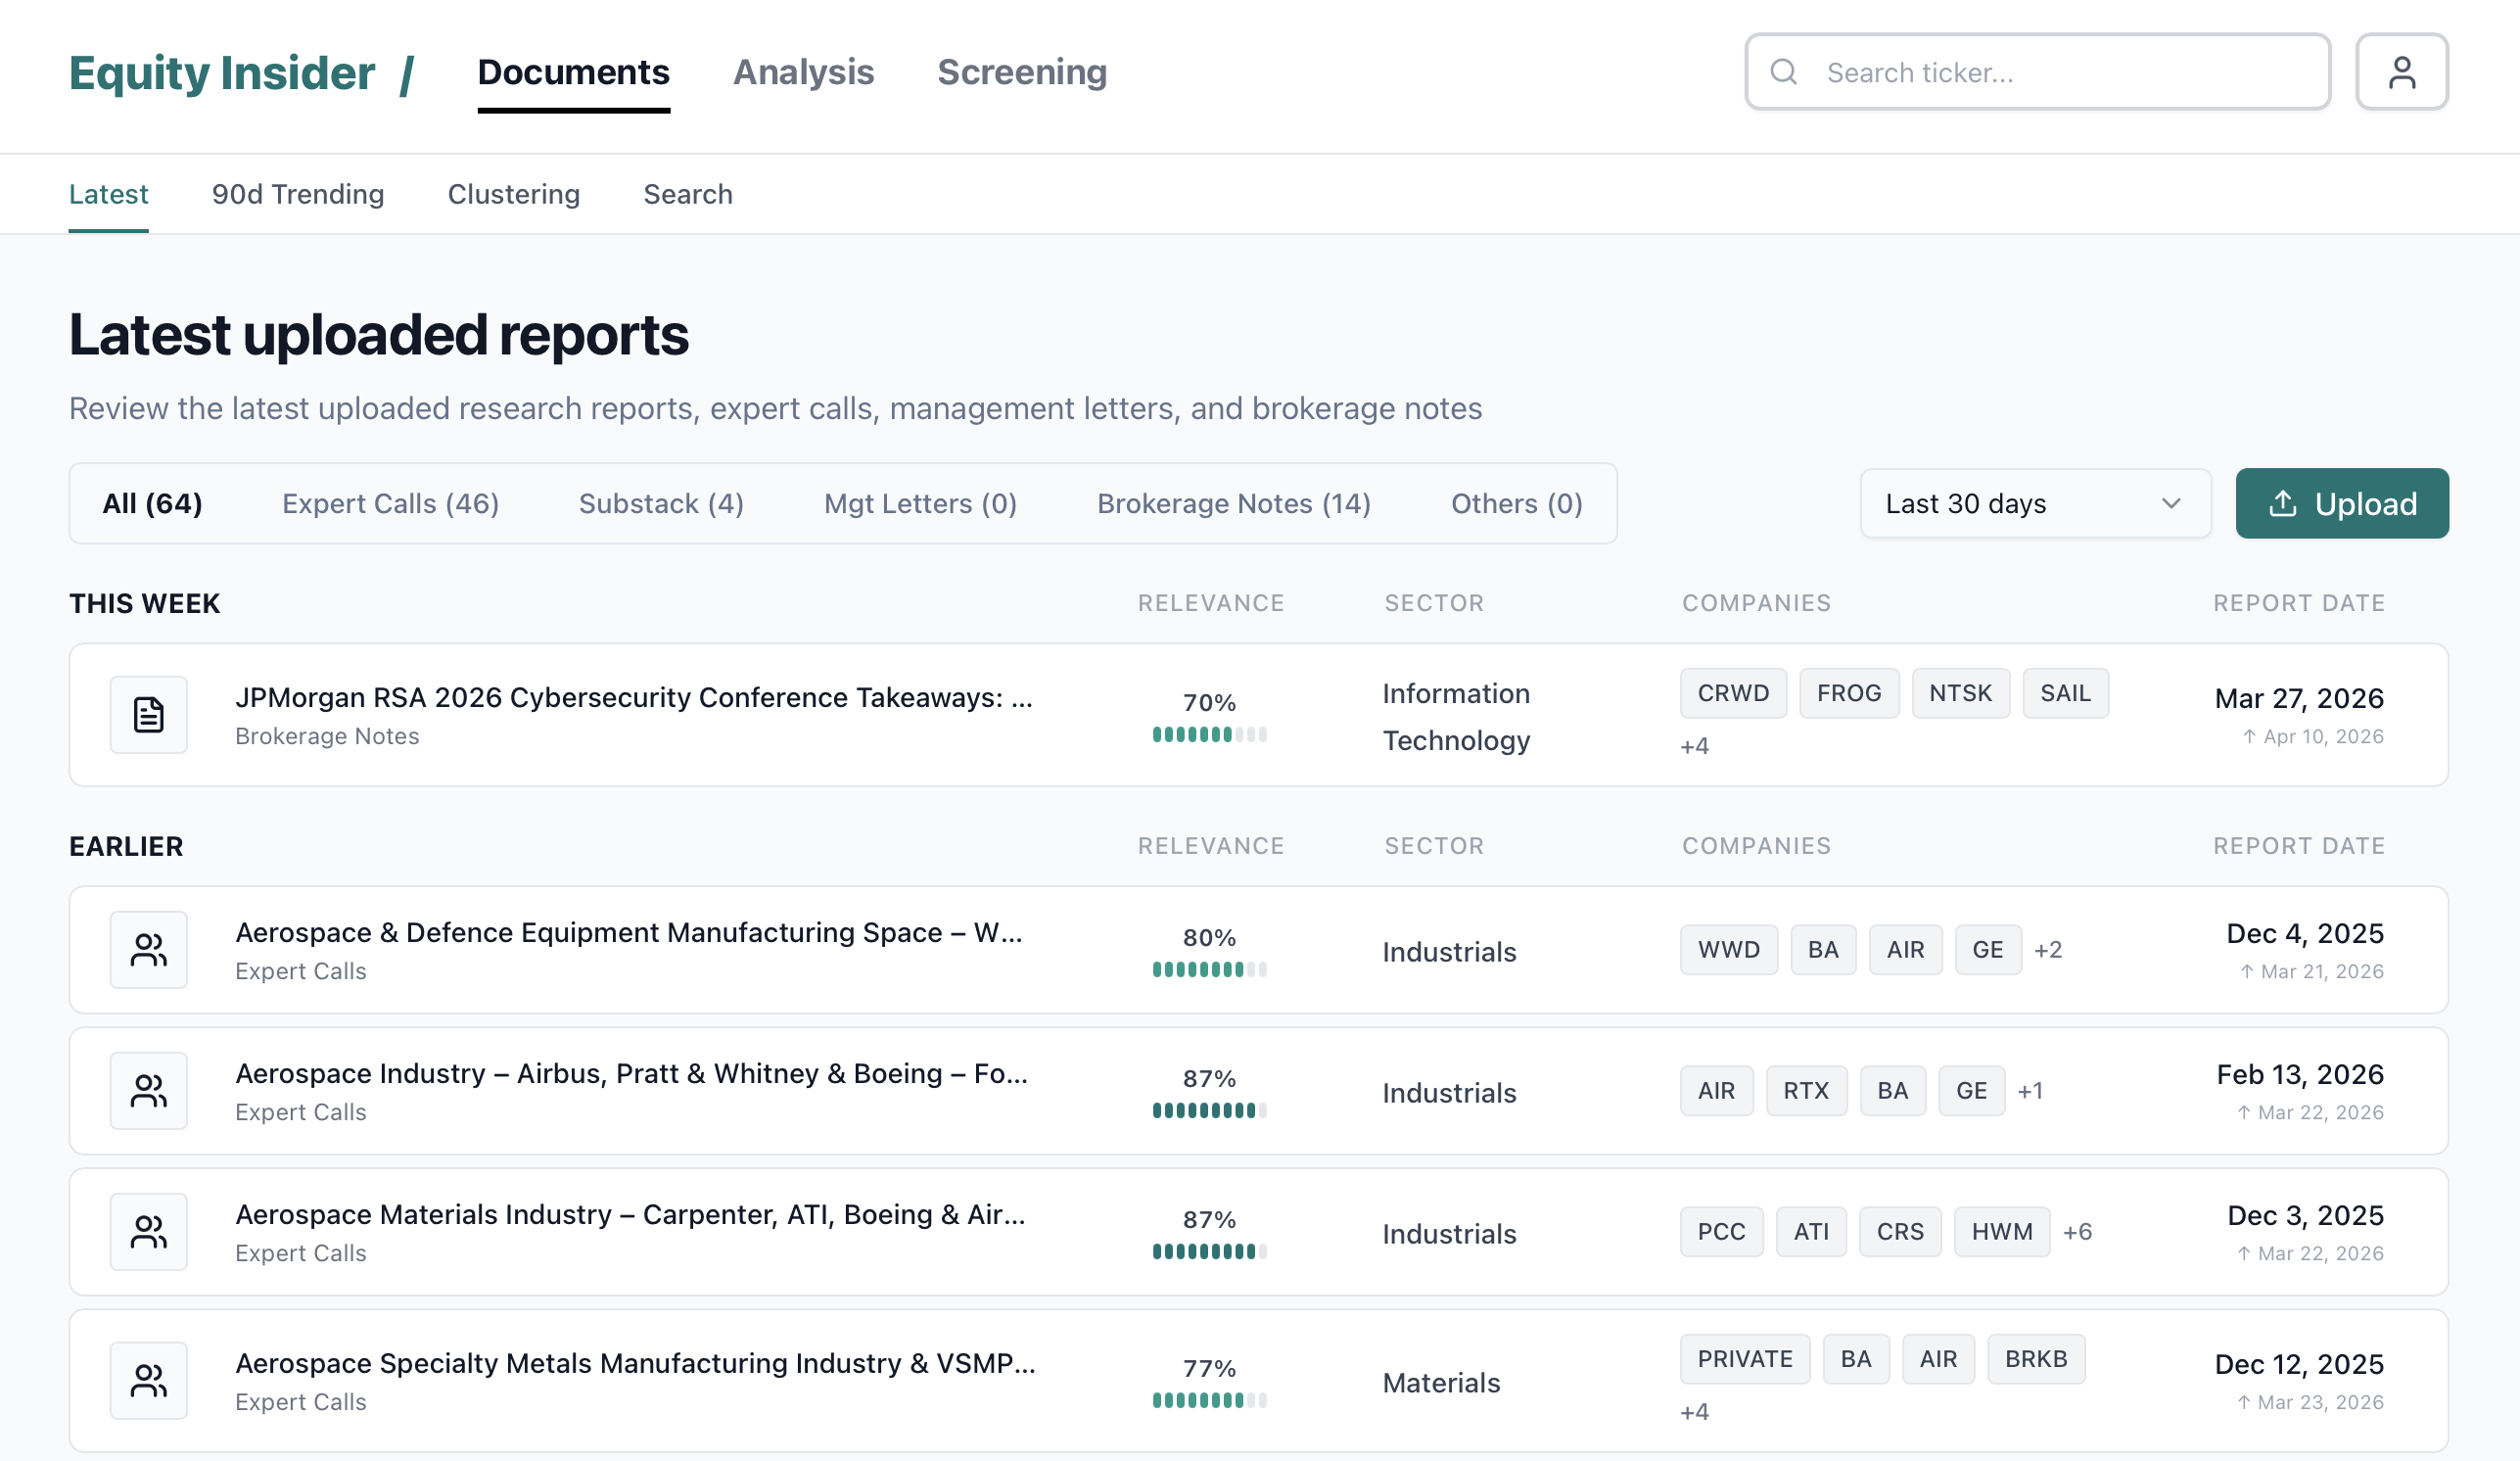
The starting point is a live feed of uploaded documents across expert calls, Substack posts, management letters, brokerage notes, and other bespoke research sources. Every file is analyzed, classified, and linked to sectors and companies.

Build a proprietary research corpus quickly, without manual tagging, and centralize fragmented inputs before they become investable signals.

Document side panel and structured analysis

Viewer: structure signals at ticker level

Each document is decomposed into company-level outputs with Micro Sentiment, Macro Context, Surprise, and Quality. This turns qualitative language into a repeatable framework: intrinsic company tone, market and sector backdrop, comments going against consensus, and management behavior or shareholder orientation.

Compare soft information across companies on a consistent basis and detect where the narrative differs from the market’s prior.

Clustering

Clustering is the exploratory workspace for plotting companies or raw mentions across two score dimensions, highlighting outliers versus the regression baseline, and surfacing the groups that deserve follow-up.

Exploration
Clustering overview with company aggregates

Clustering: analyze position versus regression

Clustering maps companies against one another across two dimensions, here Sentiment versus Context. The framework highlights names that sit away from the regression line, with green markers flagging companies roughly one standard deviation above the relationship.

Identify dislocations where stock-specific language is stronger or weaker than the sector backdrop would suggest.

Clustering hover state and ranking linkage

Kongsberg case: identify true outliers

In this example, Kongsberg stands out as an outlier with high scores on both measures. The linked ranking panel and tooltip make it easy to understand whether the name is exceptional on one variable or across the full setup.

Surface names worth deeper work because the tone is unusually strong relative to both company-specific and market framing.

Clustering mentions mode with focus enabled

Mentions mode: move from company aggregate to raw evidence

The same framework can be applied at mention level rather than company aggregate, which gives a more granular read on whether the signal is broad-based or driven by a handful of specific documents.

Validate whether an apparent signal is robust enough to support conviction or still too dependent on sparse evidence.

Industry View

The industry workflow organizes research activity by sector and subsector. It combines counts, sentiment history, position tracking, and a company universe built from the current document set.

Analysis
Industry page for Aerospace and Defense

Industry view: aggregate the story at sector level

This page rolls signals up by sector and subsector, combining mention counts, aggregate sentiment, 13F coverage, and directional evolution through time. It turns document noise into a sector map of where attention and positioning sit.

Distinguish stock-specific signals from broader industry rotation and focus diligence where a whole vertical is inflecting.

Company View

The company page consolidates all research tied to a single ticker and then breaks it into recent documents, peer comparison, ownership context, and trend details.

Deep Dive
Company overview for Rolls Royce Holdings

Company page: consolidate the full story in one place

The company page centralizes all available evidence for a single ticker: sentiment, trading activity, catalysts, and the evolution of bullish, neutral, and bearish language over time.

Review the complete qualitative setup of a name before an earnings call, investment committee discussion, or follow-up with management.

Company trends and mentions tab

Mentions and trends: track the change in underlying evidence

The trends tab breaks the story into monthly evidence with mention counts, Micro and Macro readings, Surprise, and catalyst mix. This makes it clear when the narrative started to move and whether that move has persistence.

Pinpoint inflection timing and see whether the story change is getting reinforced or fading.

Peer group comparison tab

Peer comparison: frame the name relative to its comp set

The peer tab compares the company against the names most often discussed alongside it. Relative differences in Relevance, Sentiment, Surprise, and Quality are visible immediately.

Sharpen long/short and relative-value thinking by seeing which company is improving faster than the rest of the basket.

Score Ranking

Ranking is the screening layer. Users can build filters, choose which dimensions sort the list, inspect changes over 3 or 6 months, and open a per-company score decomposition for auditability.

Screening
Ranking page sorted by change metrics

Ranking: use the full score stack as a screener

The ranking page brings every score into a screening workflow. In this example, the universe is filtered to Industrials, but the same logic works across all sectors and measures, including catalysts such as Contract Loss or Product Launch, and mention count filters to plausibilize the signal.

Build a targeted list of names where both the signal and the evidence density are strong enough to justify research time.

Ranking company popup with historical decomposition

Score drill-down: audit the change behind the ranking

Clicking a company opens the full decomposition: period changes, document-level contributions, and final scores across dimensions. The popup links the rank to the actual evidence rather than leaving it as a black box.

Challenge the signal quickly and understand whether the current setup is driven by one document or a broader change in the information set.

Ranking column picker menu

Column choice: adapt the screen to the question

The column picker mixes static, actual, range, and change metrics. That lets the investor move from absolute quality screens to inflection screens without rebuilding the workflow elsewhere.

Screen for improving stories, not only high-scoring ones, by emphasizing rate of change where it matters.

Ranking view emphasizing signal evolution

Story change: see inflections over time in one click

From the ranking view, one click reveals the evolution of sentiment and related signals through time, together with document contribution. This is the fastest way to isolate a real story change rather than a static high score.

Identify narrative breaks early, understand what caused them, and judge whether the market reaction is still lagging the information change.